 Rex Intelligence · 93 reports
Stop guessing.
Let Rex Intelligence help you run your business.
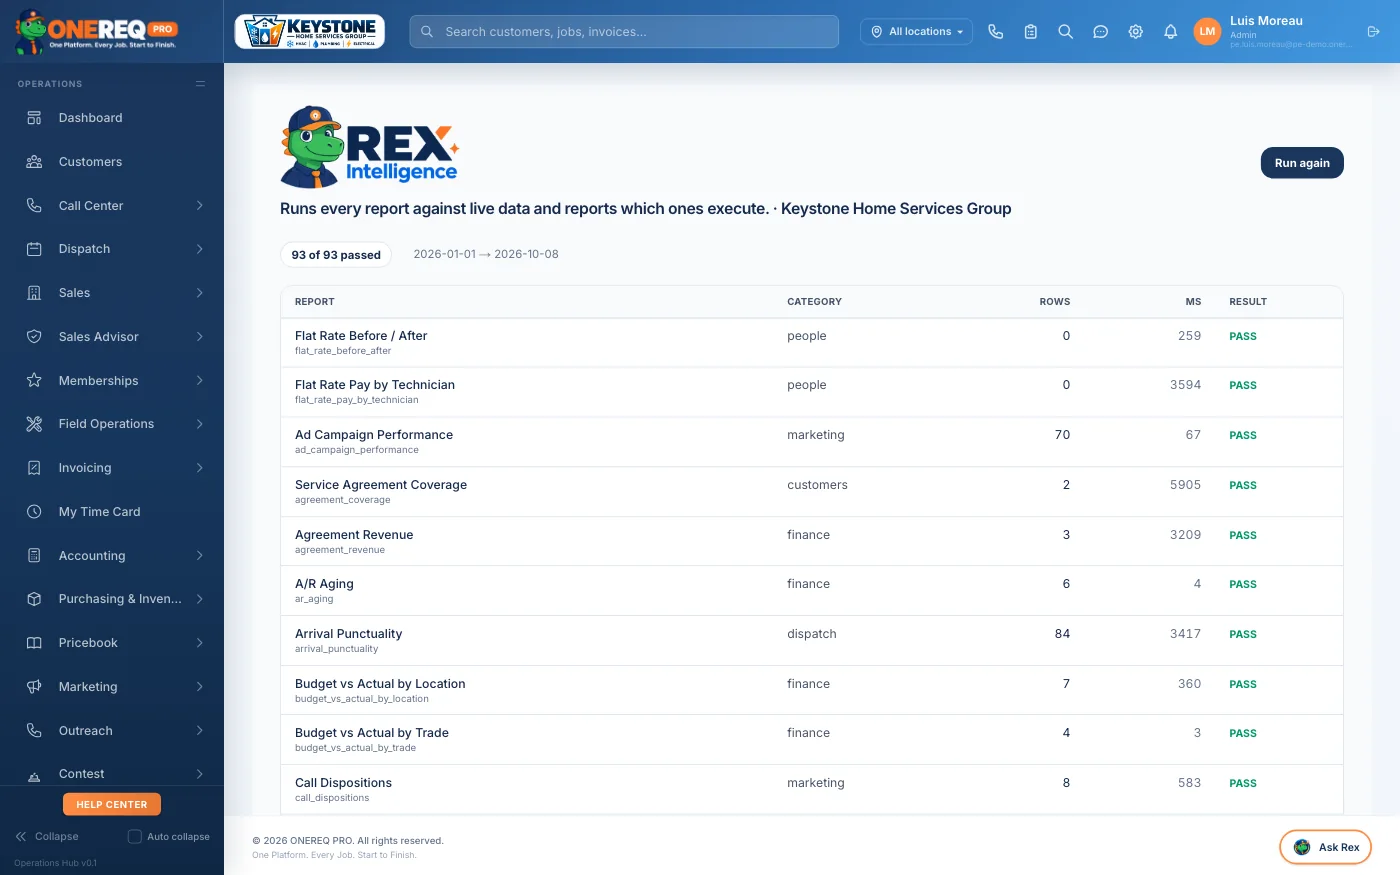
Rex tells you what’s failing, what needs improvement, where hours are being wasted, and whether your margins are good — across sales, dispatch, the trucks, marketing and your people. 93 reports, each with one definition, an Exception Center that flags what needs you this week, or just ask Rex in plain English.
Which number is the real one?
You’ve lived it. The dashboard says one thing, the invoice report says another, and your bookkeeper says a third. Nobody can say which is right, so every Monday meeting starts with an argument about the data. Rex ends that argument.
“Collected” means one thing.
Cash that actually arrived, net of tips and surcharges. Nothing else gets to wear that label. When you also need to know how much of last month’s billing has been paid so far, that’s a different, clearly named number, so the two can never be mistaken for each other.
- Same figure on the dashboard, the report and the export
- Totals are calculated from the underlying rows, never averaged from the rates above them
- A technician with two quotes doesn’t count the same as one with two hundred
A blank beats a guess.
If a labor rate, margin or tax rate isn’t set, Rex doesn’t plug in something that looks plausible. It tells you what’s missing and how much of the picture it covers. Your margin figure never quietly flatters you.
- “42% margin, 300 hours not yet costed” beats a clean 42% built on a guess
- No rate shows “not enough data yet,” not 0%
- ETAs appear only when they come from real movement
When books disagree, you see it.
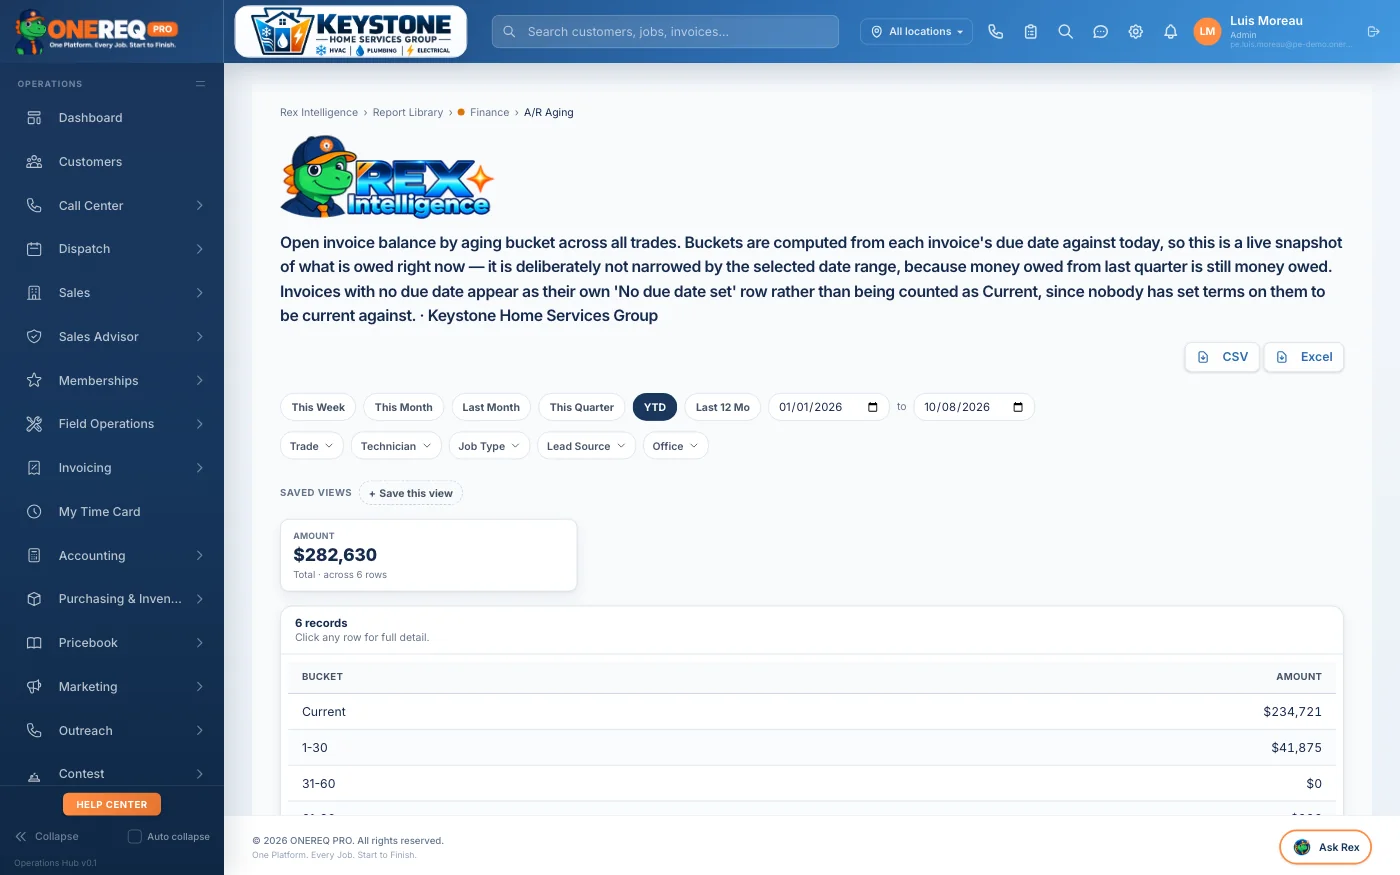
If your payments ledger and your invoices ever don’t match, Rex doesn’t pick a winner behind your back. It shows you the difference: payments with no invoice, invoices marked paid with no payment. That’s your bookkeeper’s month-end close, done before month-end.
- An invoice with no due date is reported on its own, never filed under “Current”
- One rule for “overdue,” used on every screen
- A cancelled or disputed invoice never shows up as overdue
We didn’t get here by accident. We went through our own code, found “collected revenue” calculated five different ways, and rebuilt it so a sixth can’t ship. That’s the standard your numbers get held to.
Every question a GM asks on Monday morning.
93 reports, grouped by the question you’re trying to answer, not by how a database happens to be laid out.
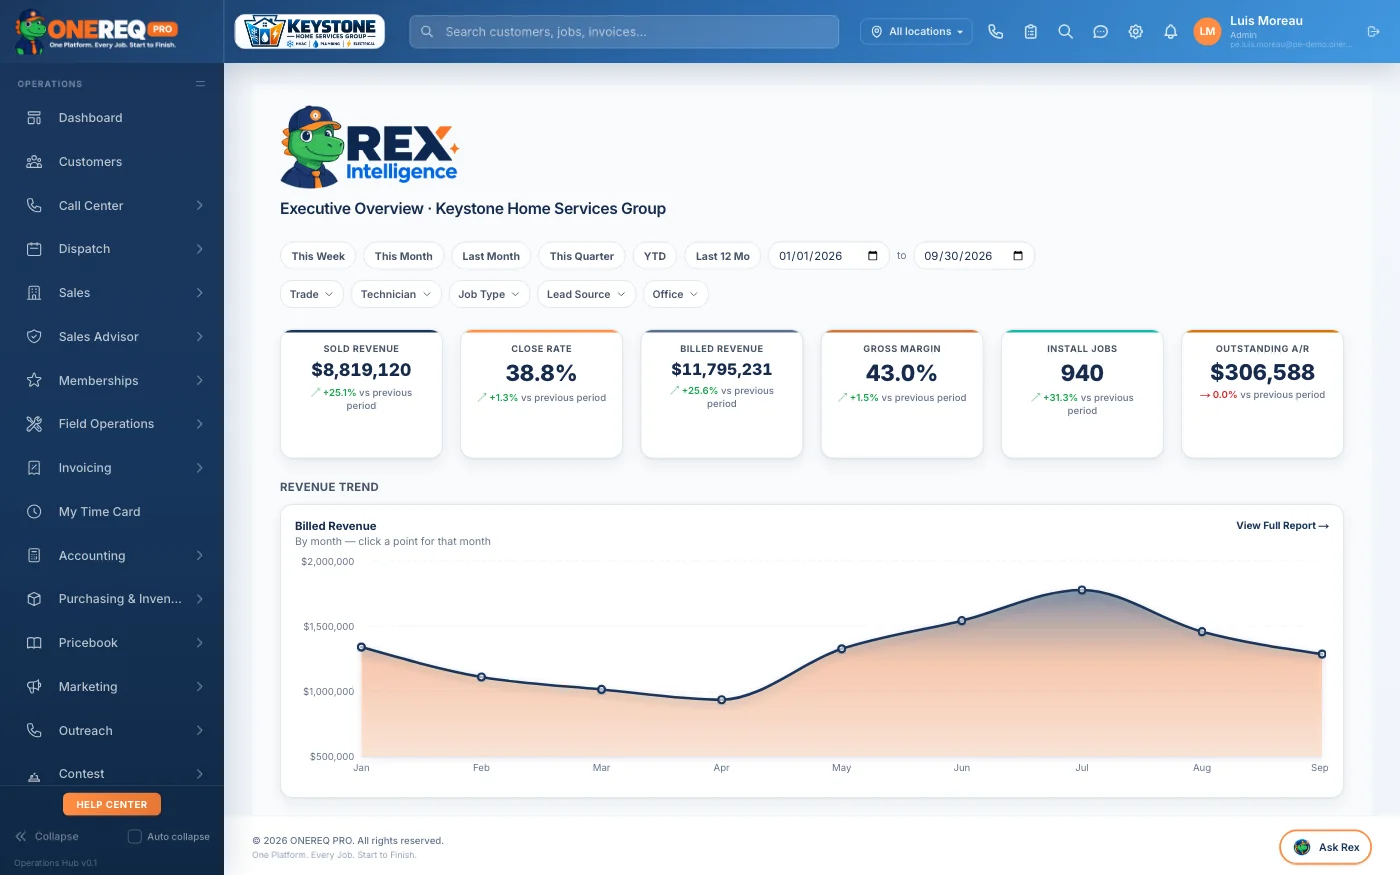
“Are we getting paid?” — 19 reports
A/R aging, open and overdue invoices, payments received, payment-method mix, non-cash settlements, trade performance, invoice margin, job cost breakdown, revenue by GL account, commissions by rep and the commission approval queue, rebate pipeline, warranty reserve, agreement revenue, budget vs actual by trade and by location.
“What’s happening in the field?” — 17 reports
Job and project pipeline, job and install mix, status, jobs by technician, jobs needing attention, callbacks and recalls, repeat visits, cancellations and reschedules, permit status, warranty claims, trucks below minimum stock, inventory consumption.
“Who’s closing?” — 18 reports
Sales funnel, won and lost quotes, quote aging, sales by advisor, lead source and trade, quote engagement, estimate pipeline, membership sales, financing applications. Options offered by every tech and salesperson, calls where no options were offered, option tier mix, and whether your contests actually moved sales (contest impact and ROI).
“Is marketing working?” — 11 reports
Lead provider performance, lead response time, campaign and ad performance, dialer productivity, call dispositions, phone call volume, review performance, referral program.
“How is the business doing?” — 10 reports
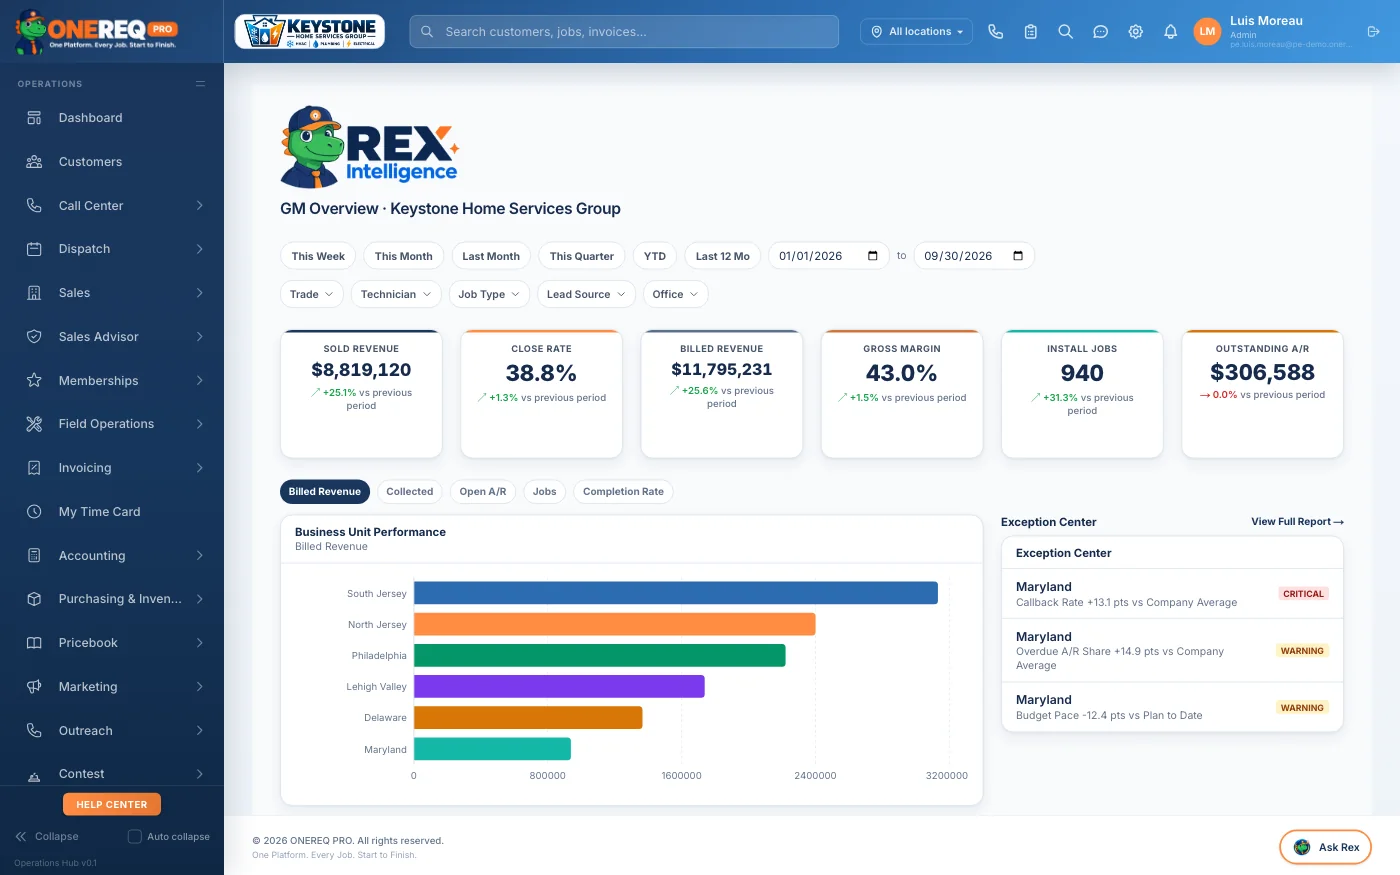
Scorecard, trade insights, sales health, budget pace, needs-attention, revenue mix by trade and lead source, plus the GM business-unit scorecard, trade scorecard and Exception Center.
“Who’s earning their keep?” — 18 reports
Technician performance, hours, billable ratio, review scores, commission by payee and flat-rate pay. Customer lifetime value, new vs returning, dormant customers, agreement coverage. Arrival punctuality, dispatcher throughput. Net profit by trade, job margin and labor cost by pay type.
Roll up every location without a spreadsheet per location.
When you’re buying, integrating or running a platform of home-service companies, the first thing that breaks is comparability. Rex fixes that on day one.
One yardstick for every location.
Revenue, margin, close rate and A/R mean exactly the same thing in every business unit, so a ranking is a ranking and not an accounting disagreement.
The Exception Center tells you where to look.
Status flags are fixed, documented threshold comparisons against a baseline, with a minimum sample size. A five-job location can’t top or bottom a percentage ranking on a lucky week.
Budget vs actual, by trade and by location.
See pace against plan before the month is over, not after. Straight-line projection off what you’ve actually achieved, labeled as exactly that.
Everyone sees only their lane.
Report access is set per role. Your GMs see their business, your operating partners see the group, and nobody opens a report they shouldn’t.
Skip the report. Just ask.
“Which tech has the most callbacks this quarter?” Type it the way you’d say it. Rex picks the right report, date range and sort, then gives you an answer you can trust.
It answers from your reports, not from thin air.
Rex can only answer from the 93 defined reports, and every figure in the answer is computed by the same code that powers the report itself. It can’t make a number up because it never writes the numbers.
It only sees what your role sees.
Ask about a report your role can’t open and you get a clear “not included in your role,” not a quiet answer from somewhere else. Money figures are only answered for people allowed to see them.
Every question is logged.
Allowed or denied, each question is recorded with who asked, what was asked and what came back. That’s the audit trail an owner, a controller or an investor wants.
Before you ask.
Bring a number you don’t trust.
Pick the figure your current system reports two different ways. In a 30-minute demo we’ll show you how ours is defined and what it says about your shop. No deck, no slides.